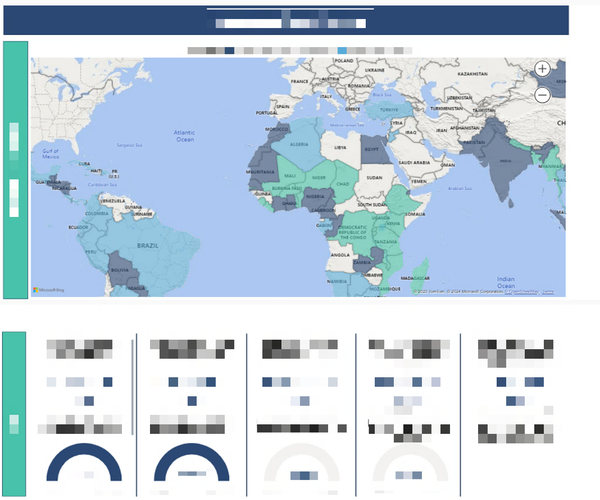

For any customized solution developed, I design interactive reports in Power BI that empower users to explore data dynamically and thus, effortlessly revealing valuable trends and patterns. The data retrieved from a customized solution are enriched by diverse data sources, enabling comprehensive analysis. Moreover, the reports prioritize scalability and security, implementing a robust solution that fosters confident growth while upholding stringent data security protocols.
Decrease in time needed to update and refresh data in the dashboard as compared to excel-based solutions
Increase in the level of interactivity and drill-down capability offered by dashboards as compared to excel-based solution
Dashboards based on large datasets created

